
Last Friday I spent my lunch break going through some links I had marked for future reading. One of them was a post earlier this month by Erik Darling about a new troubleshooting tool he made called “sp_pressure_detector,” including a video showing how to use it.
Why yes, I do often spend my lunch breaks watching videos of folks executing queries. Is it really so strange?
Anyhow, Darling’s tool is designed to provide five data sets showing a quick view of memory and processor usage based on several dynamic management views (DMVs). It’s gives you a quick look into what’s going on when the CPU and/or memory of your SQL Server instance are feeling discomfort.
Why do I mention this? Because little did I know the very next day I would be presented with a fine opportunity to use this tool. And by opportunity I mean a server on fire. (Well, not literally, but still…)
What Difference Does It make
Before I go any further, let me elaborate a bit more on sp_pressure_detector.
What it is: for the most part, just a few queries of some DMVs contain information about processor and memory usage. Maybe you could write these queries yourself, but that would take time. And when queries are consuming server resources like Mr Creosote at lunch, you definitely don’t have time.
What it is not: a list of suggestions. Unlike tools like sp_Blitz tools which give recommendations, sp_pressure_detector only gives you information. There is no “Kill this SPID” or “This execution plan should be escorted out of the building” suggestions, but there is a whole lot of information that allows you to get a sense for what is causing the problem.
OK, so here’s what happened. It’s Saturday morning, I’m on my first cup of coffee and studying for my 70-762 exam (yes, really), and in comes the alert “CPU at 100%!!!” for one of my employer’s most critical servers. Getting this alert on a Saturday isn’t unexpected, as my employer sells cars. People buy cars on Saturdays. At least, they TRY to buy cars until the server CPUs are engulfed in cataclysm of flaming queries.
Heaven Knows I’m Miserable Now
I open up the laptop and jump into an online discussion with about a dozen folks. Like middle school dances, these chat rooms can have a lot of talk with hardly anyone knowing what move to make. I tell them I’m looking into the situation, and then exit and start dancing with my SQL Server tools.
Now, as many of you know, there are several wonderful free tools available. I mentioned sp_Blitz, and of course there is sp_whoisactive, and a host of other scripts you may have found Googling around the interwebs over the years. Heck, even the Microsoft Tiger Team has their own set of SQL Server tools publicly available.
I love those other tools, but this situation was CPU-specific so I thought I’d give sp_pressure_detector first crack at the problem. (EDIT: I know, we’re like a dozen paragraphs into the post and NOW is when I finally get to the point of the post.)
Install, execute, and…five sets of info were quickly returned. The first set of info was memory related. And while I quickly noticed there was a query with a 5 GB memory grant using a few MB (ugh!), I knew memory pressure wasn’t the issue. We have monitoring for things like page life expectancy and buffer cache hit ratio, so I made a quick note of that query and decided to research more on Monday. You know, when the server wasn’t such a bonfire.
I checked final section: looks like dozens of connections with the same query, each using 10s (100s?) of thousands of cpu_time with 10s (100s?) of millions of logical_reads.
Scroll to the right: they all showed was a degree of parallelism (dop) of 1. Wait, what?
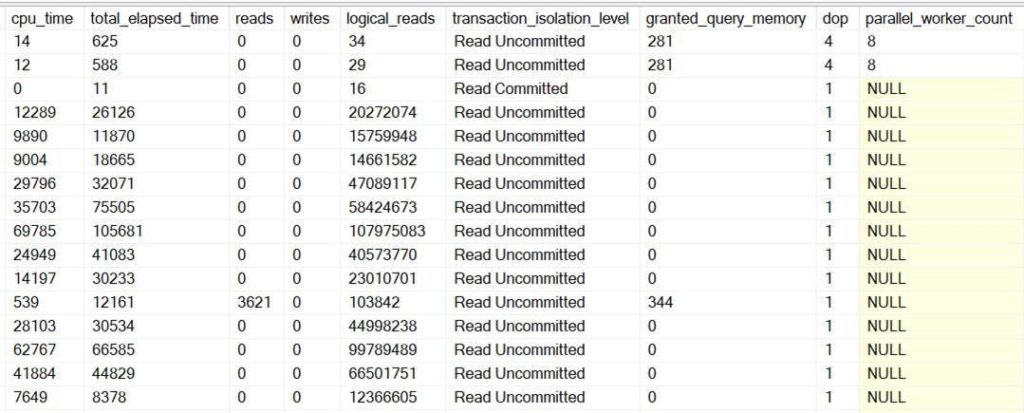
Click on the plan for one of them: it showed two clustered index scans of large tables with an estimated cost of…8? Haha! Liar.
Now, I know I work with smart people who created this query to use covering indexes, but this current plan showed SQL Server was ignoring those. I’m no rocket surgeon, but even I could tell this was a horrible, no good, very bad plan that needed to be changed.
I’m trying to keep it simplistic here, so here’s the point: My problem wasn’t solved yet, but understand I got all this information and made a determination about the cause in about the time it took you to read those last five paragraphs. To me, the ability to quickly collect the relevant information about CPU (and memory) pressure is the greatest value of sp_pressure_detector.
Please Please Please Let Me Get What I Want
Still, the hard work was done. From here I could go into Query Store and confirm there had indeed been a new plan generated in the last few hours. I don’t know if you’ve ever looked deep into the soul of an execution plan, but if you right-click and “Show Execution Plan XML…” you can see a lot more info than just those fancy operator icons and pipes. I checked this new bad plan and scrolled down to the <Parameter List> and saw blank values passed for the parameters. So yeah, I guess that’s one way to turn the Index Seeks for this query into Clustered Index Scans.
Anyhow, I got the execution plan to revert back to the previous good plan. The queries started rolling through much faster, CPU utilization decreased to 20%, and cars could be sold again.
And there was much rejoicing.
If this were a Paul Randal post we’d be in the Call To Action section now. I’m no Paul Randal, but I will say it is worth your time to consider adding sp_pressure_detector as a weapon in your database troubleshooting arsenal. It can definitely save you time when servers are burning and all you really want to do is get back to your Saturday morning reading.
Did you use the DAC as suggested to run the query? It would be nice to see how you ran the query.
Hey Chris,
Although I was ready to use it, I didn’t need the DAC this time. The 100 percent utilization wasn’t as 100 percenty as it said, since there were threads available to connect. Coincidentally, that’s another thing sp_pressure_detector tells you as well, once you’ve connected of course.
So the SQL Server was waiting on CPU? Was there Threadpool waits in the sp_pressure_detector output as well?
There weren’t any THREADPOOL waits, which is also something sp_pressure_detector showed. CPU utilization alerts often indicates all logical cores are utilized, not all worker threads. In my case the high utilization alert that caused the freakout was a result of an inefficient plan for a highly used stored procedure, resulting in more way reads and CPU utilization (all with a DOP of 1) than necessary.
So sp_pressure_detector showed the 100% CPU utilization wasn’t really an issue of CPU pressure; it was more of an observable side effect than the cause of performance problems. I probably should have explained that better.
I had a similar case when users complained about slowness. So I decided to launch sp_pressure_detector. In the CPU eaters section appeared few Select’s which usually executed in miliseconds, but now took five to ten seconds. There were Threadpool waits and threads_waiting_for_cpu. But what confused me was the fact that aivailable_threads was more than 400. So why there were Threadpool waits if threads are available? I think the column namings are missleading. It should be “tasks waiting on a worker”.
So I edited the proc to fit my understanding 🙂
Great post Jeff! I have had sp_pressure_dectector saved for a while but never really used it. Good to know its a great diagnostic tool, though I doubt I’d get too much value out of it in my current role.
“I got the execution plan to revert back to the previous good plan”
– can you provide any details on how you did this? I am hoping there is a secret “revert to last plan” command but I am guessing it is a little more convoluted than that.
Historically I have had to use dbcc freeproccache and then seed the plan with a “good” query.
Hey Frank,
Fortunately reverting the plan was very simple: we have Query Store turned on for this database, and since no objects used in the execution plan had been dropped we were able to force usage of the previous plan.
Encountered these on 2012 servers.
Msg 207, Level 16, State 1, Procedure sp_pressure_detector, Line 91
Invalid column name ‘reserved_worker_count’.
Msg 207, Level 16, State 1, Procedure sp_pressure_detector, Line 92
Invalid column name ‘used_worker_count’.
Yeah, it was noted in the comments of Darling’s post I linked that this only works for SQL Server 2016 and later. So sorry.